Avero's Group Sales Overview Report
Available in: Essentials and Professional subscriptions
The Group Sales Overview provides high level insight into key operating metrics across all of your businesses. The Group Sales Overview will allow you to select up to 3 metrics to compare Covers, Checks, Promotions, and Sales across your businesses as well as a group total.
*Please note: A group total will not be available when comparing businesses that report in different currencies.
Group Sales Overview will allow you to accomplish the following:
- Track and compare metrics such as Covers, Check counts, Sales, Promotions, Gross Average Check, Global Category Sales across multiple locations
- Set new Sales Goal for each location and/or for your Group
- Track how weather affects your levels of business
In this article, the following topics will be discussed:
- Running a Group Sales Overview Report
- Viewing the Group Sales Overview Report
- Managing Beverage % of Sales Across Multiple Locations to Drive Revenue
Running a Group Sales Overview Report
The Group Sales Overview is located under the Sales heading in the Avero sidebar. If you have access to two or more businesses, you will have access to this report. The default settings on the report will show you the total of yesterday's Gross Sales but you can use the Report Generator to adjust the information you want to generate.
Every Avero report has a unique Report Generator to help you filter your results using metric filters. This is the meat of your report. Each report within Avero has a defined number of metrics that can be included in one report. We have defined all of the metric options on the Metrics page. Once you have made your choices, hit Go.
Using Attributes and Tags
Attributes and Tags are fully customizable and will help you organize all of the businesses within your enterprise, into distinct groups based on similar characteristics. This is allows you to easily compare predefined, like concepts, quick and easy.
Example: if a "Region" attribute is selected, then the next step would be to select the specific region you want to analyze. Once selected, the businesses with that pertain to that specific region will group together. Tags will then extract businesses from that grouping.
Viewing the Group Sales Overview Report
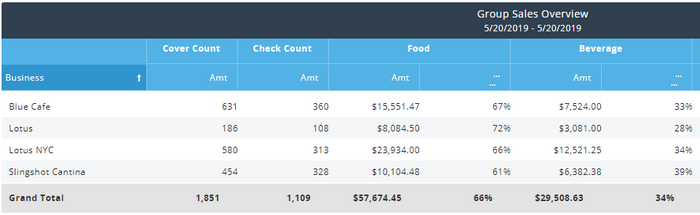
The Group Sales Overview will not have a visualization. When you run the report, you will only see a table. When viewing the table, keep the following in mind:
- The table will list your businesses down the far left-hand column.
- To the right of each business, you will see columns breaking out the Sales for Global Category.
- You will see category % of sales to the right of the sales amount.
- There are totals for the Sales of each Category on the bottom row labeled Grand Total.
- There is also a Total column to the right of your Category Sales which gives you Total Gross Sales for each Business and for the Group.
- In the last two columns, you will see the amount of Promotions (Comps) applies for each Business.
- The final column provides Net Sales for each Business along with a total for the group in the bottom row. Net Sales are calculated by subtracting Promotions from your Gross Sales.
Managing Beverage % of Sales Across Multiple Locations to Drive Revenue
Beverage % of sales is a key reporting metric in the industry to drive revenue. For organizations that have multiple, like concepts, this report can allow you to track your top performers and review their successes over time to achieve similar numbers at your other locations. If you operate multiple concepts and are working on expansion opportunities, these metrics allow you make strategic decisions on what concept would be most profitable.
When comparing your beverage %, we would recommend using like concepts such as all fine dining versus casual dining concepts for an apples to apples comparison. Run a baseline of data (we would suggest the last 8 weeks) to see which business has the highest beverage % of sales. Investigate what they are doing differently and see if you can implement the same practices across multiple properties and track moving forward.
New Initiatives can also be easily tracked using the Group Sales Overview. Maybe you want to offer different size options for wines by the glass, create a new happy hour menu, or roll out a server beverage training program. This can be done at 1 or more locations and then track sales over time to see if the new incentives impact the PPA or Beverage % of sales. If successful, you can choose to roll out the initiative at your other locations.
See our Beverage Sales Insights to Protect Profits for more tips and tricks on tracking!
See this report in your inbox every day:
Set up an Email Schedule...

Click the Envelope to set up an email schedule.
...Or Pin it to your Dashboard.
Click the Speedometer to add to your Dashboard. (hint: make sure you've chosen a trended or dynamic date type).