Avero's P&L Report
Avero's outlet P&L report helps you align your finance and operations with a daily and instant updates based on when you make cost entries.
Use this report to uncover ares of profit or loss with category drill-down capabilities, empowering you to change your restaurant's outcomes. By keeping a closer eye on the P&L as it changes, operators can make decisions that will impact your P&L in a positive way. This article will discuss the following topics:
Running a P&L Report
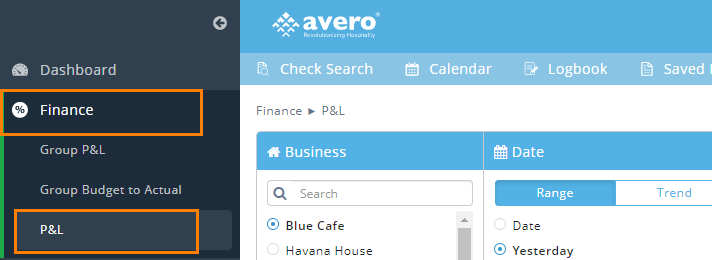
The P&L report is located under the Finance heading in Avero. This report relies on the budget you have already entered. If you have not yet entered your budget details, please see How to Set Up a Budget to get that process completed.
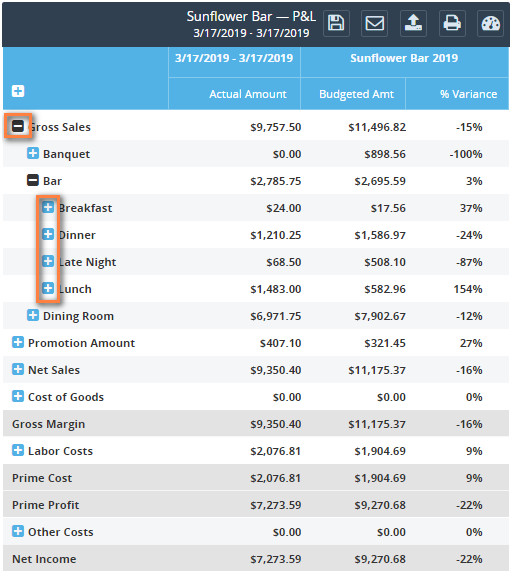
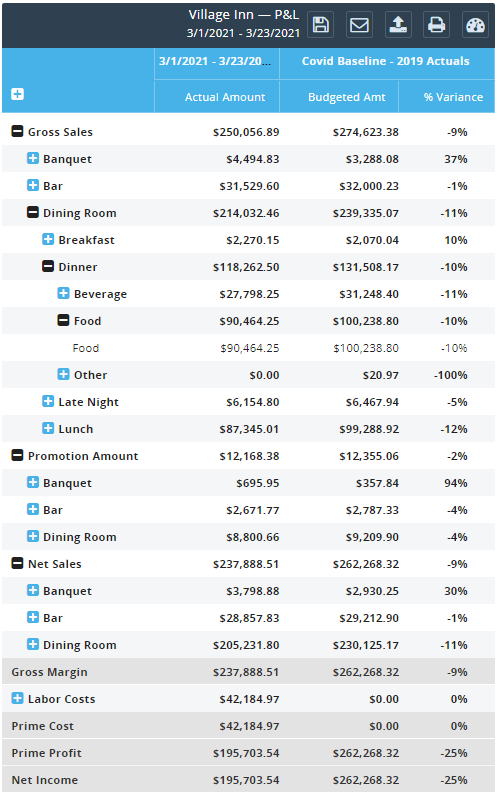
The default setting on this report will show you the most recent data related to your budget. Through this report, you will see the following:
- Actual Amount sold or spent
- the Budgeted Amount
- % Variance.
Every Avero report has a unique Report Generator to help you filter your results using metric filters. This is the meat of your report. Each report within Avero has a defined number of metrics that can be included in one report. We have defined all of the metric options on the Metrics page.Once you've made your choices, hit Go. For instructions on how to utilize the Report Generator, reference this article.
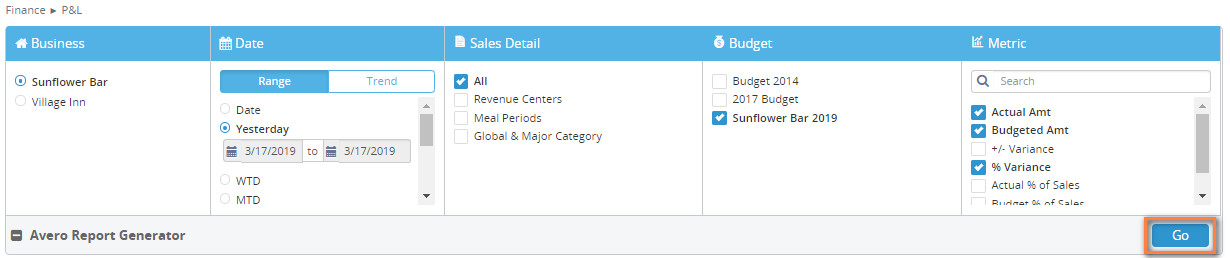
Sales Detail
This filter allows you to choose how you view the data in the report. You can breakdown your sales and budget by Revenue Center, Meal Period, Global & Major Category, or choose all for a comprehensive P&L report.
Budget
This category will contain the budgets you have defined in Finance Set Up. The primary budget will be the one selected by default. Avero stores all of the historical budgets you create so you can reference them in the future and learn from past P&L reports.
Viewing the P&L Report
The P&L report will display the budget details collapsed with subtotals. When viewing the report, keep the following in mind:
- You can click the + and - signs to expand the details you'd like to see.
- The first column on the report will show you the current sales and cost amounts.
- The second section will be the budget you selected.
- You'll see the budgeted amounts as well as the variance between the actual and budget.
Covid 2021 vs 2019 Reporting
Running the Comparison Report - YO2019
To run & automate a Year-over-2019 report, first set up a 2019 actuals budget, see our instructions here: Budget Setup
Select P&L (or Group P&L if you have multiple businesses) under the Finance tab.
Select the report metrics, using your Covid Baseline/ 2019 Actual budget as the reference:
You will have a comparison of current performance to 2019 actual performance! Use the envelope icon to schedule this report to run regularly.
This report can show up in your inbox each week, automatically:
Set up an Email Schedule...

Click the Envelope to set up an email schedule.
...Or Pin it to your Dashboard.

Click the Speedometer to add to your Dashboard. (hint: make sure you've chosen a trended or dynamic date type).