Avero's Overtime Report
Available in: Professional subscriptions only
Paying attention to and minimizing your overtime is crucial to managing your labor costs and minimizing your overhead. With the Overtime report, cut and call in your employees more strategically by tracking their progress towards overtime throughout the pay-week. This report also allows you to act on opportunities to re-arrange the floor chart or BOH to ensure those employees nearing overtime are off your clock before they get there.
In this article, the following topics will be discussed:
Running an Overtime Report
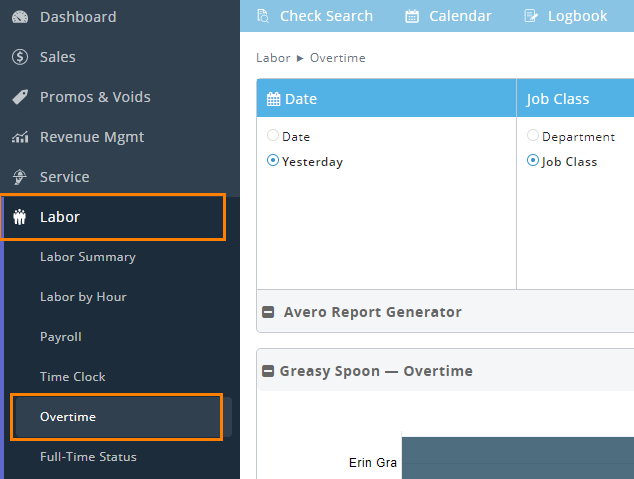
Overtime is located under the Labor tab in Avero. When you first run the report, the default will show you the pay-week, week to date summation of hours worked as of yesterday for all employees at the business selected.
Every Avero report has a unique Report Generator to help you filter your results using metric filters. This is the meat of your report. Each report within Avero has a defined number of metrics that can be included in one report. We have defined all of the metric options on the Metrics page.Once you've made your choices, hit Go. For instructions on how to utilize the Report Generator, reference this article.
Job Class
Avero reflects the Job Classes as they are defined in your POS (if labor is integrated into your POS) or time clock system. These are also tied to departments, such as Front of House or Back of House.
Hours to Overtime
One of the most vital reports to automate to control labor proactively. Using this filter allows you to narrow down the report to only employees below a threshold of hours left prior to going into overtime. This filter allows you to very quickly identify who within your staff is going to reach overtime the quickest. Run a quick report with < 4 selected to see who among your servers should be cut first.
Viewing the Overtime Report
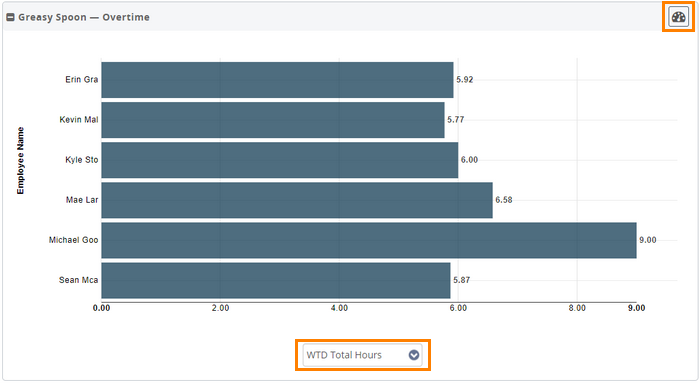
The Overtime visualization is displayed as a bar graph. When viewing the bar graph, keep the following in mind:
- There will be a bar displayed for each employee.
- Scroll down to see all employees.
- Use the drop down menu to toggle between metrics.
- Use the speedometer icon to pin this report to one of your dashboards for easy viewing.
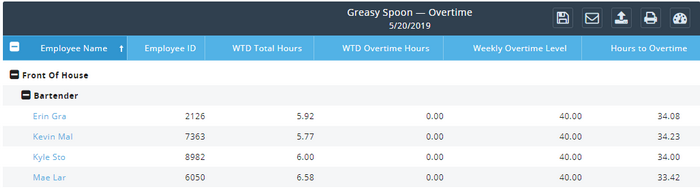
The Overtime report will also display a table version. When viewing the table, keep the following in mind:
- The table will group employees by Job Class, and then Department.
- Click the + and - signs to expand or collapse a business or department.
- You can also click on the name of each employee (hyperlinked in blue), to see a Time Clock report, which will bring you to their individual punches.
Schedule this report to come automatically:
Set up an Email Schedule...
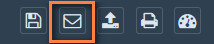
Click the Envelope to set up an email schedule.
...Or Pin it to your Dashboard.
Click the Speedometer to add to your Dashboard. (hint: make sure ou've chosen a trended or dynamic date type